
Why Expense Ratios Matter More Inside a Roth IRA
A Roth IRA is one of the most powerful savings tools available to everyday Americans. You contribute after-tax dollars, your investments grow, and qualified withdrawals in retirement come out completely free of federal income tax. That long time horizon makes even tiny annual fees surprisingly important — a fraction of a percent shaved off every year compounds into real money over decades.
So when you’re picking a broad U.S. stock ETF for your Roth IRA, the expense ratio deserves a front-row seat in your decision. Three funds come up again and again in this conversation: VTI (Vanguard Total Stock Market ETF), SCHB (Schwab U.S. Broad Market ETF), and SPLG (SPDR Portfolio S&P 500 ETF). Here’s what each one actually costs, what’s inside it, and how to think about the choice.
The 2025 Roth IRA Contribution Limits (Know Your Ceiling)
Before getting into the funds themselves, let’s set the stage. For tax year 2025, the IRS allows you to contribute up to $7,000 per year to a Roth IRA (source). If you’re age 50 or older, you can add a $1,000 catch-up contribution on top of that, bringing your total to $8,000 (source). These limits apply across all your IRAs combined — traditional and Roth — not per account.
Every dollar you contribute is working for you, which is exactly why keeping fund costs low matters so much here.
Meet the Three Contenders
VTI — Vanguard Total Stock Market ETF
VTI is issued by Vanguard and tracks the CRSP US Total Market Index (source), meaning it aims to capture virtually the entire U.S. stock market — large-cap, mid-cap, and small-cap companies all in one fund. It’s one of the largest ETFs in existence by assets under management.
VTI carries an expense ratio of 0.03% per year (source). On a $7,000 Roth IRA contribution, that works out to about $2.10 in annual fees. That’s not a typo — two dollars and ten cents.
VTI holds a broad range of stocks, with a heavy tilt toward technology, followed by financial services and consumer cyclicals (source). Its top holdings include Nvidia, Apple, and Microsoft (source).
SCHB — Schwab U.S. Broad Market ETF
SCHB is Schwab’s answer to VTI. It tracks the Dow Jones U.S. Broad Stock Market Index (source) and similarly covers the full U.S. equity market across large-, mid-, and small-cap stocks.
Like VTI, SCHB carries an expense ratio of 0.03% (source). Its sector allocation is led by technology at 32%, followed by financial services and healthcare (source). Its top three holdings are Nvidia at 6.72%, Apple at 5.83%, and Microsoft at 4.37% (source).
SCHB holds a somewhat narrower range of stocks than VTI — about 2,401 companies compared to VTI’s 3,598 (source). Both funds are designed to give you straightforward broad U.S. market exposure with no gimmicks.
SPLG — SPDR Portfolio S&P 500 ETF
SPLG is issued by State Street and tracks the S&P 500 Index (source), which means it focuses exclusively on large-cap U.S. companies — roughly the 500 largest publicly traded firms. That’s a meaningfully different mandate from VTI and SCHB, which also include mid- and small-cap stocks.
SPLG’s expense ratio comes in at 0.02% per year (source) — the lowest of the three. On that same $7,000 Roth IRA contribution, you’d pay about $1.40 per year in fees.
SPLG holds about 506 stocks (source), and its top holdings include Nvidia, Microsoft, Apple, Amazon, and Broadcom (source).
Side-by-Side Cost Comparison
| Fund | Issuer | Expense Ratio | Index Tracked | Approx. Holdings |
|---|---|---|---|---|
| VTI | Vanguard | 0.03% | CRSP US Total Market | ~3,598 |
| SCHB | Schwab | 0.03% | Dow Jones U.S. Broad Stock Market | ~2,401 |
| SPLG | State Street | 0.02% | S&P 500 | ~506 |
Sources: VTI expense ratio, SCHB/VTI comparison, SPLG/VTI comparison
On pure cost, SPLG wins by a single basis point (0.01%). That translates to about $0.70 per year on a $7,000 investment. It’s real, but it’s tiny.
The Key Difference: What’s Actually Inside Each Fund
This is where the comparison gets more interesting than the expense ratios alone.
Total Market vs. Large-Cap Only
VTI and SCHB are both total-market funds. They hold large-cap stocks — the household names like Apple and Nvidia — but they also hold mid-cap and small-cap companies. That broader exposure means you own a slice of thousands of businesses across the entire U.S. economy.
SPLG, on the other hand, tracks the S&P 500 (source). It holds only large-cap stocks. Mid-cap and small-cap companies are left out entirely. That’s not a flaw — it’s just a different strategy. Historically, large-cap stocks have driven the bulk of overall market returns, and many investors are perfectly happy with S&P 500 exposure alone.
The practical implication: if you think small- and mid-cap stocks will outperform over your investment horizon, VTI or SCHB give you that exposure. If you want a simpler, large-cap-only approach at the absolute lowest cost, SPLG delivers that.
VTI vs. SCHB: Spot the Difference
Choosing between VTI and SCHB means comparing two funds that are nearly identical in purpose, cost, and sector makeup. Both carry a 0.03% expense ratio (source, source). Both tilt heavily toward technology at around 32% of assets (source). Both share the same top holdings — Nvidia, Apple, and Microsoft.
The meaningful differences are:
- Number of holdings: VTI holds about 3,598 stocks vs. SCHB’s approximately 2,401 (source). VTI’s larger roster means slightly deeper small-cap exposure.
- Fund size: VTI is one of the largest ETFs in the world by assets under management, which can translate to tighter bid-ask spreads when you buy or sell. For a Roth IRA investor making periodic contributions, this difference is rarely meaningful in practice.
- Brokerage fit: SCHB is Schwab’s own fund. If your Roth IRA is at Schwab, SCHB fits naturally into your existing account. VTI is Vanguard’s flagship. Either fund works at virtually any major brokerage.
For most everyday investors, the choice between VTI and SCHB comes down to which brokerage you use and personal preference — not any meaningful financial difference.
Does a 0.01% Difference Actually Matter?
Let’s put some numbers around this. SPLG’s 0.02% expense ratio is one basis point cheaper than VTI’s and SCHB’s 0.03%.
On a $7,000 annual Roth IRA contribution (source):
– VTI or SCHB at 0.03%: roughly $2.10 per year in fees
– SPLG at 0.02%: roughly $1.40 per year in fees
The annual savings: about $0.70. Over 30 years, even compounded, that’s a negligible difference. The more important question is whether you want total-market exposure (VTI/SCHB) or large-cap-only exposure (SPLG) — that portfolio decision will have a far larger impact on your returns than a single basis point in fees.
At these expense ratios, cost is essentially a tie. All three funds rank among the cheapest investment vehicles available to retail investors anywhere in the world.
Roth IRA-Specific Considerations
Contribution Limits Apply to the Account, Not the Fund
The $7,000 annual limit (or $8,000 if you’re 50+, using the $1,000 catch-up contribution (source)) applies to your total Roth IRA contributions — not to any individual fund. You can hold all three of these ETFs inside a single Roth IRA if you want, as long as your total contributions don’t exceed the annual limit.
Share Price and Fractional Shares
VTI’s latest closing price was $374.36 (source), meaning a single share costs more than $374. That matters if your brokerage doesn’t offer fractional shares. SPLG and SCHB typically trade at much lower per-share prices, making them easier to buy in smaller dollar amounts when fractional shares aren’t available. Check whether your brokerage supports fractional ETF shares before deciding — many major brokerages now do.
The “Set It and Forget It” Argument
For a long-term Roth IRA, simplicity has real value. All three of these funds are designed to be core, long-term holdings. You don’t need to monitor them actively. Pick one that matches your desired market exposure (total market vs. large-cap), confirm it’s available at your brokerage, and contribute consistently up to your annual limit.
Other Vanguard ETFs Worth Knowing About
While we’re on the subject of low-cost Vanguard funds, a few others are worth a quick mention — especially if you’re building a multi-fund Roth IRA portfolio:
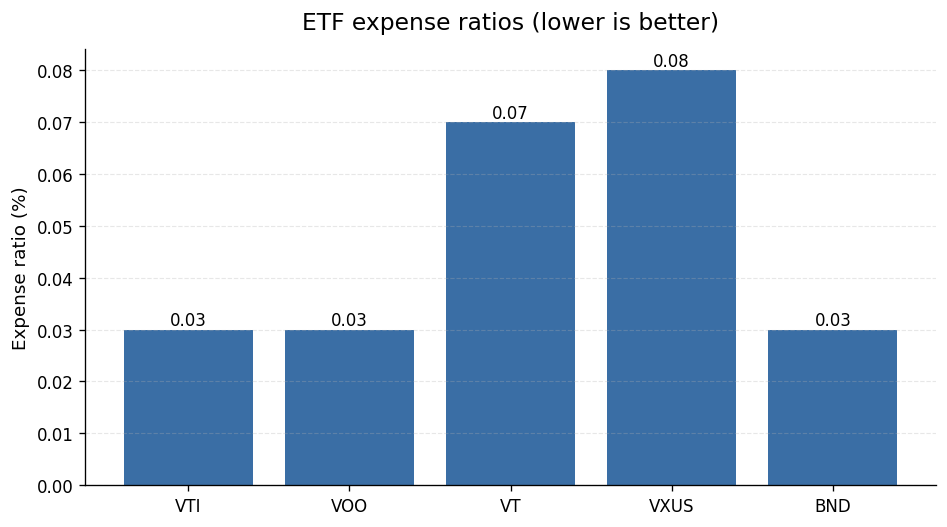
- VOO (Vanguard S&P 500 ETF): Like SPLG, VOO tracks the S&P 500. It carries a 0.03% expense ratio (source) — one basis point more than SPLG.
- VT (Vanguard Total World Stock ETF): Expands beyond the U.S. to include international stocks. Expense ratio is 0.07% (source).
- VXUS (Vanguard Total International Stock ETF): Covers non-U.S. stocks only, often paired with VTI for a two-fund global portfolio. Expense ratio is 0.08% (source).
- BND (Vanguard Total Bond Market ETF): A broad U.S. bond fund at 0.03% (source), useful for adding a fixed-income allocation as you approach retirement.
None of these are required for a simple Roth IRA strategy, but they’re solid building blocks if you want to customize your allocation.
The Bottom Line: Which One Should You Choose?
Here’s a simple framework:
Choose VTI if: You want the broadest possible U.S. market coverage, you value Vanguard’s long track record and massive fund size, and you’re comfortable with a higher share price.
Choose SCHB if: Your Roth IRA is at Schwab and you want a total-market fund that fits naturally into your existing account. It’s functionally nearly identical to VTI at the same cost.
Choose SPLG if: You want the lowest expense ratio of the three, you’re comfortable with large-cap-only exposure (no mid- or small-cap stocks), and you prefer a lower per-share price for easier dollar-amount investing.
For most people reading this, the right answer is whichever fund you’ll actually stick with through market ups and downs. All three are excellent, low-cost choices. The gap between them is measured in fractions of a penny per dollar invested. Don’t let the comparison become a reason to delay contributing — getting money into your Roth IRA consistently matters far more than splitting hairs between 0.02% and 0.03%.
This article was researched using official U.S. data sources cited inline and reviewed for accuracy before publishing. It is general information, not personalized financial advice. For decisions specific to your situation, consult a licensed professional.
Data refreshed: 2026-06-04. Editorial accuracy verified for cited sources only.
Related reads
- Does FDIC Insurance Cover Online Checking and Money Market Accounts? A Plain-English FAQ
- CD Ladder Strategy for 2026: How to Use Treasury Rates as Your Benchmark
- Money Market Account vs. High-Yield Savings Account: Which Wins When Inflation Is Still Elevated?
Armin Cole has been personally investing in index funds and ETFs
for over three years. He started Nestvestify to document what he’s
learning and make data-backed personal finance accessible to everyday
readers — without the jargon. All articles are grounded in official
U.S. data sources including the Federal Reserve (FRED), SEC filings,
and the Bureau of Labor Statistics.